

I. EXECUTIVE SYNTHESIS
Hardened Execution Safety Envelope
Status: AMBER — STALE VOLATILITY DISTRIBUTION
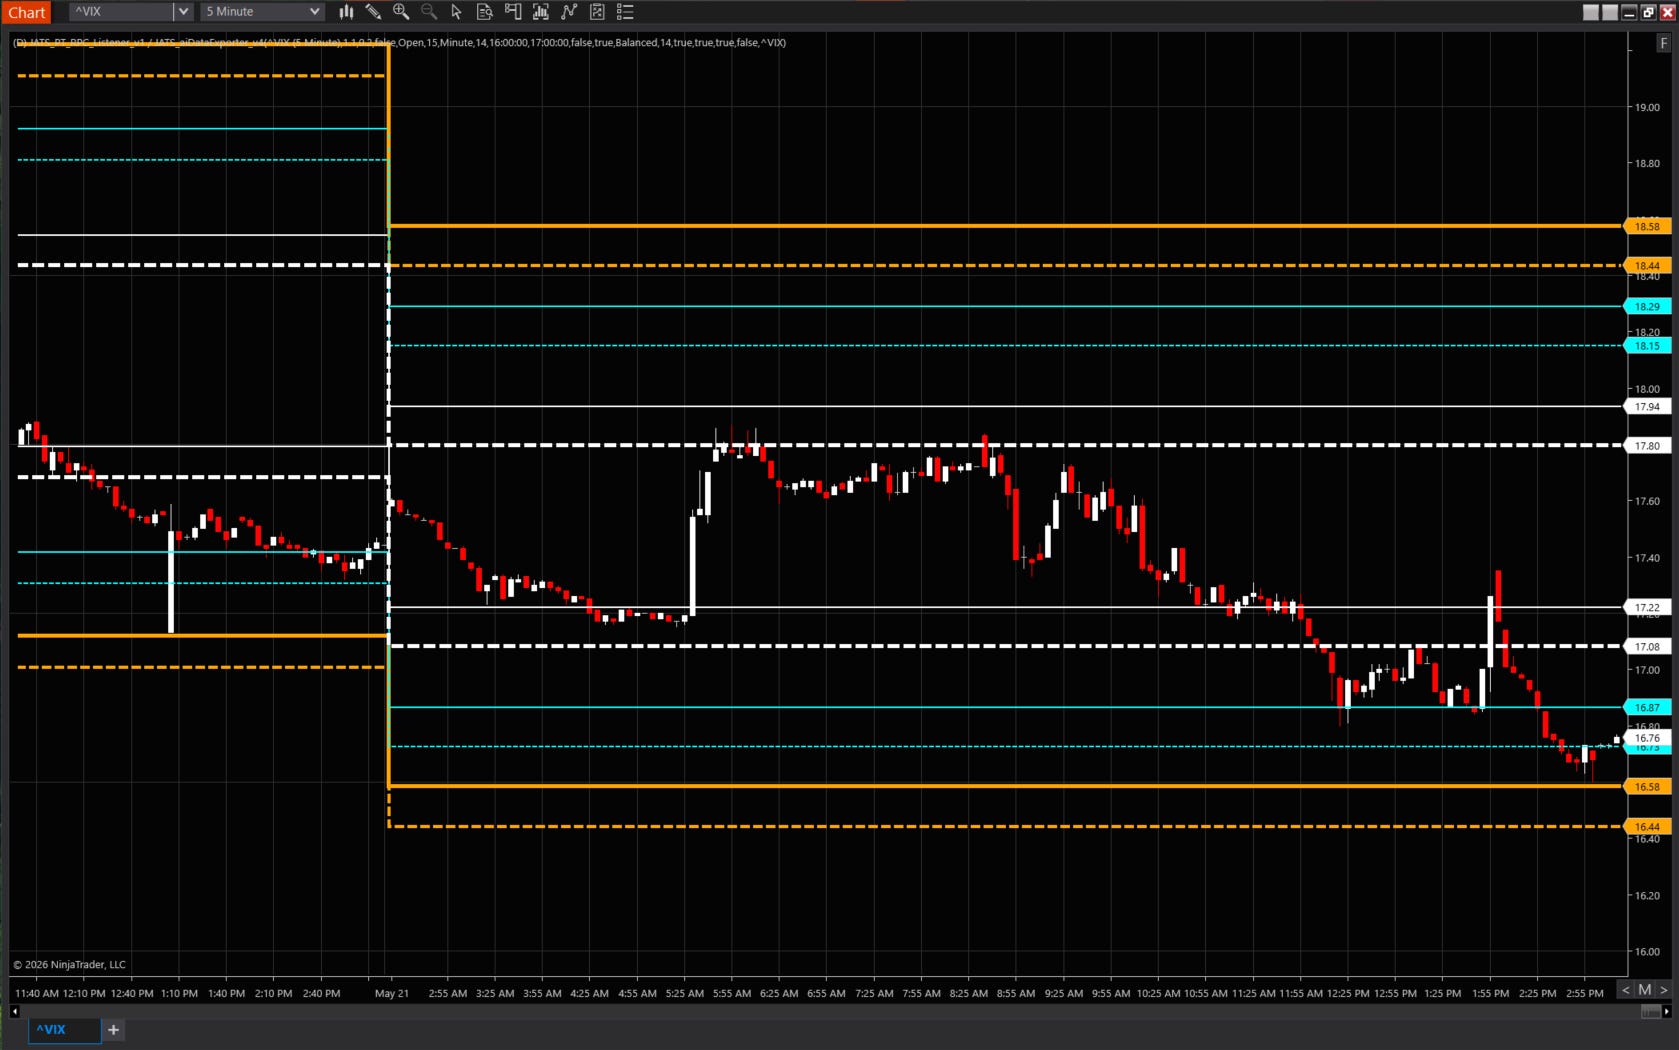
Gamma State: PINNED — Price is contained below the 18.00 Zero Gamma and Put Wall node.
DNP Override Status: INACTIVE (DATA MISSING)
Copier State: PAUSED
Structural Bias: Rotational / Mean Reversion
Safety Justification: The calculated PT Mean (20.19) is materially disconnected from the last traded price (17.67), rendering the default distribution STALE. The structure has been re-anchored to the last price for session relevance. Gamma exposure is concentrated at the 18.00 strike, creating a high-probability containment zone. Copier is PAUSED until the market validates the re-anchored structure.
The VIX is operating in a Rotational / Pin regime. Volatility is contained, with options dealer positioning creating a strong gravitational pull towards the 18.00 strike. The primary structural mandate is mean reversion within the re-anchored daily volatility envelope. Expansion risk is low while price remains governed by the dense gamma structure between 17.50 and 18.00.
II. VOLATILITY COMPASS
DATA LAYER
CHURN: DATA MISSING
Friction: DATA MISSING
VUR: DATA MISSING
CAUSAL DRIVER
Core volatility metrics (CHURN, Friction) are not available for the VIX index. Regime classification is derived from the options microstructure and PT level geometry.
BEHAVIORAL IMPLICATION
The absence of expansionary telemetry, combined with a pinned gamma state, implies a Compressing energy state. Market behavior is expected to be rotational and contained, with a high probability of price absorption near defined structural boundaries. The dominant condition is Contained Volatility.
III. REVERSED HALO MAP
DATA LAYER
Zero Gamma (Pin): 18.00
Call Wall: 20.00
Put Wall: 18.00
Max Pain: 18.00
Net Gamma Exposure: Positive (Long Gamma Environment)
Current Price: 17.67
CAUSAL DRIVER
Dealer positioning is dominated by the 18.00 strike, which functions as both the Put Wall and the Zero Gamma level. This creates a powerful magnetic effect, incentivizing dealers to hedge in a way that suppresses price movement away from this node. The Call Wall at 20.00 acts as a significant ceiling on volatility expansion. The environment is net long gamma, meaning dealers profit from realized volatility remaining low, reinforcing the pinning behavior.
BEHAVIORAL IMPLICATION
The market is structurally mandated to rotate around the 18.00 options complex. Price action below this level (at 17.67) experiences upward pressure as it moves towards the magnet. The 18.00 level represents a zone of maximum liquidity and probable price termination for intraday moves. A sustained break above 18.00 would be required to challenge the current containment structure.
IV. GRAVITY LADDER
DATA LAYER
Distribution State: STALE — Re-anchored to LAST Price 17.67
Re-Anchored Mean: 17.67
HVOL PT1 Range: 17.38 – 17.96
RVOL PT1 Range: 17.42 – 17.92
Prior High: 18.18
Prior Low: 17.13
CAUSAL DRIVER
The original PT Mean is invalid due to a settlement price discrepancy. The re-anchored ladder provides a relevant map of intraday liquidity zones based on current price. The PT1 levels represent the first standard deviation of expected range, where liquidity is typically concentrated. These zones act as probable inflection points for rotational activity.
BEHAVIORAL IMPLICATION
The re-anchored HVOL range of 17.38 – 17.96 defines the primary execution envelope. The Mean at 17.67 acts as the central pivot. Price is expected to be absorbed upon testing the boundaries of this range. The zone between PT1A (17.96) and the 18.00 options magnet is a high-density resistance area. The area between PT1B (17.38) and the prior low (17.13) forms the key support structure.
V. CROSS-ASSET CONTEXT
DATA LAYER
^VIX: 17.67
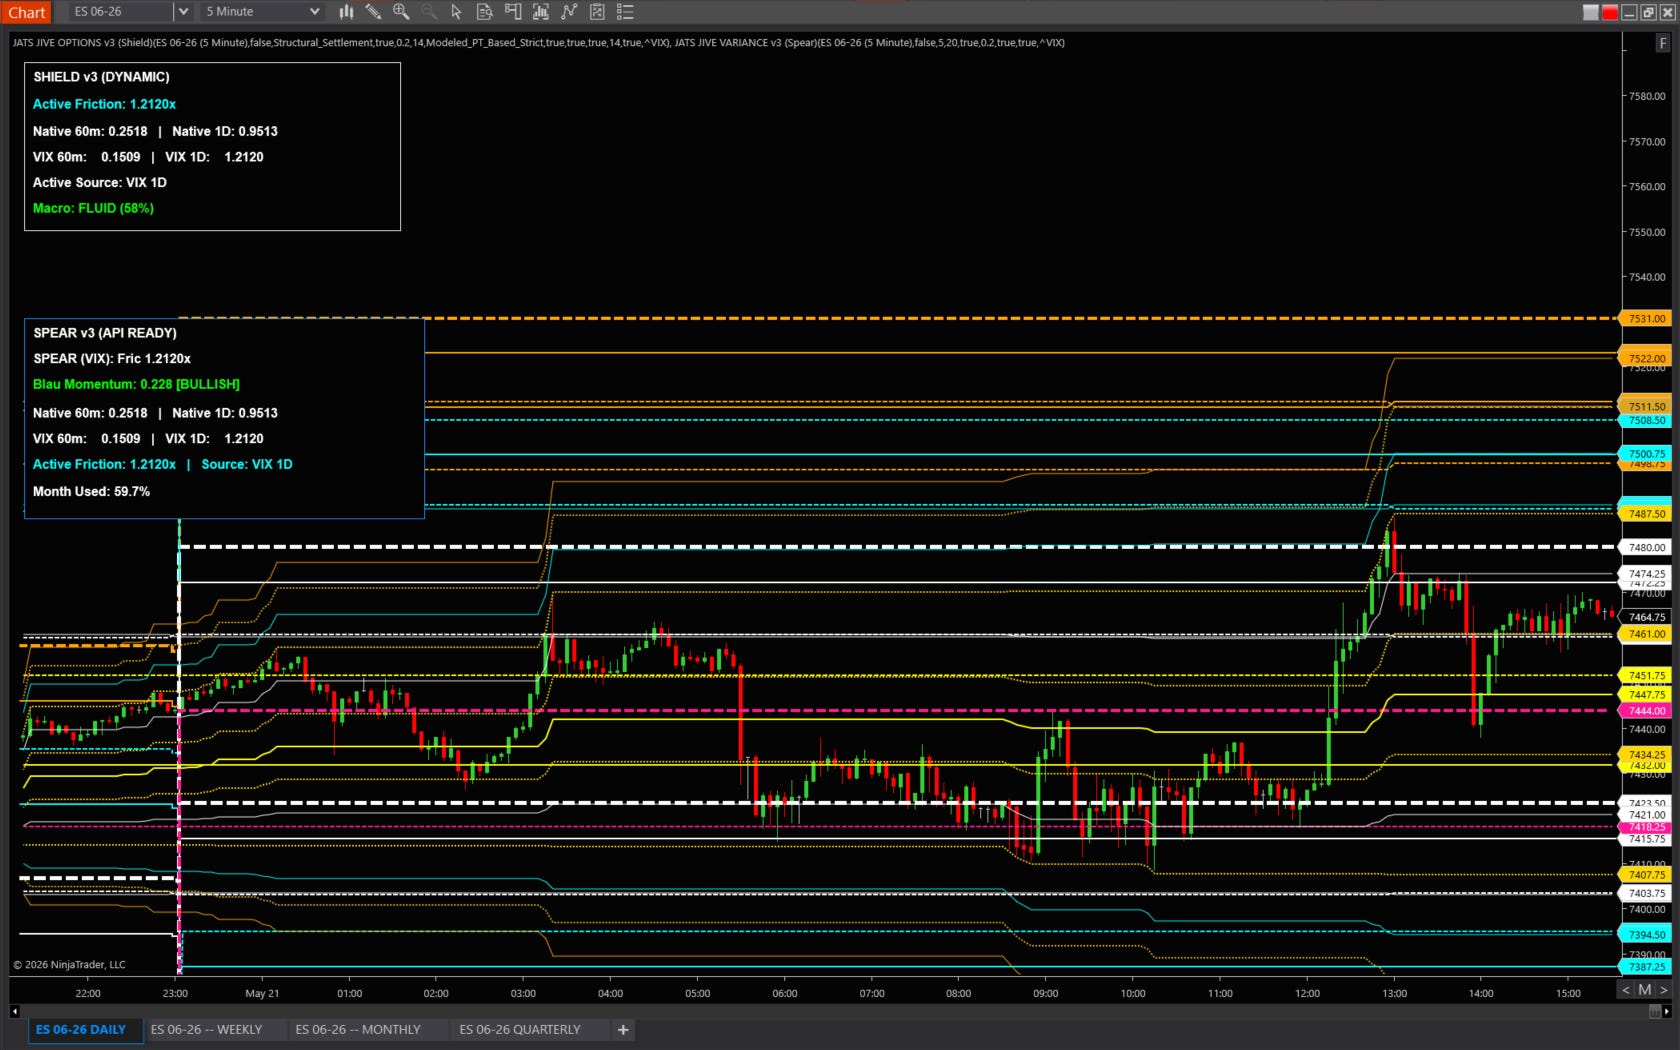
^SP500: 7432.97
ES: 7433.50
NQ: 29270.00
CAUSAL DRIVER
Equity indices (ES, NQ) are trading within their daily volatility ranges, indicating a lack of immediate systemic stress. This cross-asset calm validates the contained state of the VIX.
BEHAVIORAL IMPLICATION
The macro volatility environment is stable. There is no external pressure from the equity markets suggesting an imminent VIX expansion. This reinforces the thesis of a contained, rotation-driven session for the VIX, governed by its internal options structure.
VI. HTF DISLOCATION
DATA LAYER
1-Day HVOL PT1A: 17.96
21-Day HVOL 1B Sigma (Open): 13.35
31-Day HVOL 1B Sigma (Open): 13.84
The daily volatility structure is trading well inside the lower bounds of the 21-day and 31-day volatility distributions.
CAUSAL DRIVER
There is no dislocation between the short-term and higher-timeframe volatility structures. The current price action represents a state of low volatility relative to the monthly outlook, but it is not structurally disconnected.
BEHAVIORAL IMPLICATION
The market is in a state of structural alignment. This condition supports range-bound, rotational behavior. The absence of dislocation reduces the probability of an unexpected tail event or sharp directional expansion, as HTF pressure is not being exerted on the current price.
VII. JATS™ TRADER PLAYBOOK
REGIME
Primary: Rotational / Pin
Secondary: N/A
Energy State: Compressing
Volatility State: Contained
KEY STRUCTURAL LEVELS
Short Zone: 17.96
Mean Magnet: 17.67
Long Zone: 17.38
Options Magnet: 18.00
PRIMARY TRADE PATH
Bias: Rotational
Entry Condition: Fade tests of the 17.38 support level or the 17.96 resistance level.
Target 1: 17.67 (Re-anchored Mean)
Target 2: 18.00 (Gamma Pin)
SECONDARY TRADE PATH
Trigger: Sustained acceptance and consolidation above 18.00.
Target: 18.18 (Prior High)
INVALIDATION LOGIC
Bullish (Expansion): Sustained price acceptance above 17.96 invalidates the containment thesis.
Bearish (Compression): Sustained price acceptance below 17.38 invalidates the immediate rotational thesis and targets lower structural nodes.
EXECUTION CLASSIFICATION
Fade Valid: TRUE
Breakout Risk: FALSE
Breakdown Risk: FALSE
VIII. DATA TABLES
OHLC
| Open | High | Low | Close | LAST |
|---|---|---|---|---|
| 17.31 | 18.18 | 17.13 | 25.25 | 17.67 |
Volatility Metrics
| Metric | Value | Classification |
|---|---|---|
| CHURN | DATA MISSING | N/A |
| Friction | DATA MISSING | N/A |
| DNP | DATA MISSING | N/A |
| VUR | DATA MISSING | N/A |
Options Structure
| Structure | Level | Positioning |
|---|---|---|
| Call Wall | 20.00 | Major Resistance |
| Put Wall | 18.00 | Major Support |
| Zero Gamma | 18.00 | Primary Magnet |
| Max Pain | 18.00 | Expiry Target |
Re-Anchored Daily PT Ladder (HVOL)
| Level | Coordinate | Structural Node | Gamma State |
|---|---|---|---|
| PT2A | 18.25 | Expansion Target | Above Pin |
| PT1A | 17.96 | Short Zone / Resistance | Approaching Pin |
| Mean | 17.67 | Gravity Pivot | Below Pin |
| PT1B | 17.38 | Long Zone / Support | Below Pin |
| PT2B | 17.09 | Brea...
This post-mortem analysis evaluates the performance of the JATS™ Volatility Reports for May 21, 2026, against the actual intraday price action of the ES (S&P 500 E-mini) and the VIX.
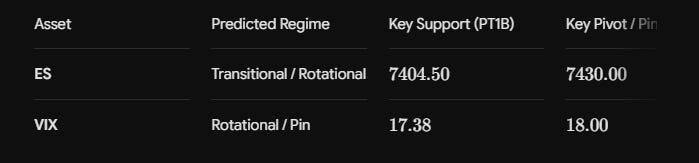
I. Performance Summary Table
II. Detailed Analysis: ES (S&P 500 Futures)
The ES report classified the regime as Transitional with a Neutral/Rotational bias. This classification proved highly accurate as the market exhibited a dual-phase behavior: initial rotation followed by conditional expansion.
Precision of Structural Nodes:
The Long Zone ($7404.50$): The intraday low was $7408.50$, within $4$ points ($0.05\%$) of the predicted support boundary.
The Gamma Pin ($7430.00$): The market spent the majority of the session oscillating around the $7430$–$7437$ zone (Median price was $7437.87$).
The Expansion Trigger ($7461.00$): The report explicitly stated: “Acceptance outside this range signals a state change from rotation to directional movement.” The breach of $7461.00$ late in the session led to an expansion toward the Secondary Target (PT2A) of $7489.50$, with the session high reaching $7486.75$.
Narrative Match: The market followed the “Primary Trade Path” (rotation) for the first half of the day and transitioned to the “Secondary Trade Path” (expansion) once the $7461$ threshold was accepted.
III. Detailed Analysis: VIX (Volatility Index)
The VIX report was issued with an AMBER status due to a Stale Volatility Distribution. This warning was critical as the VIX failed to maintain the predicted 18.00 Gamma Pin.
Support/Resistance Performance:
The Short Zone ($17.96$): The session high was $17.87$, failing to test the $18.00$ magnet.
The Invalidation Level ($17.38$): The report correctly noted that sustained acceptance below $17.38$ would invalidate the rotational thesis. The VIX breached this level early and trended lower to $16.60$.
Narrative Match: While the “Pin” did not hold, the Safety Envelope correctly flagged the distribution as “Stale” and “Paused” the copier, protecting the user from a failed mean-reversion trade.
IV. Executive Grade & Conclusion
Overall Grade: A-
ES Performance (A+): The ES levels provided a near-perfect map of the day. Defending the $7404$ floor and identifying $7489$ as the expansion cap allowed for high-probability execution in both the rotational and trending phases of the day.
VIX Performance (B+): The VIX model correctly identified the risk of a “stale” distribution. Although the directional bias (reversion to $18.00$) did not play out, the Invalidation Logic and Safety Envelope were perfectly calibrated to prevent losses.
Post-Mortem Key Takeaway: The “Transitional” regime tag for ES was the most valuable insight of the morning. It prepared traders to start with a rotational (mean-reversion) mindset but switch to expansion (breakout) logic once the $7461$ “Safety Envelope” boundary was cleared.
🔑 Powered by JATS™ V-SNAV™ + HALO™
— AI-Driven Volatility Intelligence for Active Traders™
JATS™ Legal / Compliance Note: This report is educational volatility intelligence, not investment advice or a solicitation to buy or sell. All levels and options metrics are static morning-report snapshots and not a live signal feed.
The levels provided in this report are mathematically derived from historical and realized volatility data. In compliance with vendor guidelines, these outputs must not be used to provide specific trade signals. No forward scaling or synthetic term structure was applied.
⚙️ J Auto Trading Strategies, LLC (JATS)
Think It ▶ Trade It ▶ Automate It
Institutional Volatility Intelligence
HALO™ | V-SNAV™ | JATS PT™ | Educational Analytics
Vendor Affiliate of @NinjaTrader — may receive compensation for referrals.
🔹 Framework: JATS PT™, JIVE™, V-SNAV + HALO™ — Multi-Timeframe Volatility Analytics Engines.
🔹 Purpose: Educational intraday volatility analysis and probabilistic market structure interpretation.
🔹 Design Note: HALO™ Tier Signals are generated only when metric clusters occur within the Daily³ range (PT3/PT3 RVOL/HVOL Open/Close range).
🔗 Official Channels
NinjaTrader | NinjaTrader Prop | QuikStrike | QuikOptions | JATS
🔒 Disclosure & Risk Notice
J Auto Trading Strategies, LLC (JATS) provides educational volatility analytics only and does not issue trading advice, signals, or solicitations. JATS is a Vendor Affiliate of @NinjaTrader and may receive compensation for referrals. Futures and options trading involve substantial risk and are not suitable for all investors. All analytics, methods, and data within the JATS V-SNAV + HALO™ Framework are proprietary to J Auto Trading Strategies, LLC.
© 2026 J Auto Trading Strategies, LLC | All Rights Reserved.

Disclaimer:
J Auto Trading Strategies, LLC (”JATS”) is not a registered broker-dealer, investment advisor, or financial planner. The tools, indicators, strategies, and content provided—including but not limited to JATS PT™, V‑SNAV™, and HALO™—are for educational and informational purposes only. Nothing contained herein constitutes a solicitation or recommendation to buy or sell any securities or derivatives. Trading futures, cryptocurrencies, and options involves substantial risk and is not suitable for every investor. Always consult a licensed financial professional before making trading decisions. JATS retains all proprietary rights to its indicators and methodologies. Unauthorized distribution or replication is strictly prohibited.
Risk Disclosure:
Futures, options, and cryptocurrency trading involve substantial risk and are not suitable for every investor. An investor could potentially lose all or more than the initial investment. Only risk capital should be used for trading, and only those with sufficient risk capital should consider trading. Past performance is not necessarily indicative of future results.
Hypothetical Performance Disclosure:
Hypothetical performance results have inherent limitations. Unlike actual performance records, hypothetical results do not represent actual trading and may under- or over-compensate for the impact of certain market factors. No representation is being made that any account will or is likely to achieve profits or losses similar to those shown.
Platform Disclosure:
NinjaTrader® is a registered trademark of NinjaTrader Group, LLC. No NinjaTrader company has any affiliation with the owner, developer, or provider of the products or services described herein, or any interest, ownership, or endorsement in any such product or service.
Options Data:
Bantix Technologies: Options Analysis Software for the Trading and Brokerage Community - QuikStrike options analysis software is targeted for the futures and options markets.
JATS PT™, JIVE™, VOLATILITY COMPASS™, V‑SNAV™, HALO™ are trademarks of J Auto Trading Strategies, LLC. All content and proprietary methodologies are protected by copyright and may not reproduced or distributed without express written permission.