


JATS V-SNAV and HALO Report for BTC (Bitcoin) – July 10, 2025
Generated: July 10, 2025 | Instrument: Bitcoin Futures (BTC)
Welcome
This report provides a full institutional analysis of the Bitcoin Futures contract for the July 2025 expiry using the JATS Probability Target (PT) framework. It integrates multi-timeframe volatility structures (RVOL/HVOL), dealer positioning metrics, gamma exposure analytics, and HALO signal overlays to identify strategic inflection points, directional bias, and volatility regime shifts.
Market Overview
Bitcoin opened the July 10 Globex session at 111425 and settled at 112245, marking a moderate recovery from session lows with a net change of +820 points (+0.74%). The session traded within a narrow range of 111335–112170, with the ATM strike positioned at 112500 and Max Pain firmly below at 109500, indicating dealer preference for price reversion toward lower strikes. Open interest at the ATM strike remained limited (16 calls / 0 puts), implying weak dealer hedging engagement. The 14-day realized range continues to compress near structural pivots.
Volatility Regime Context
The volatility landscape remains expansionary.
RVOL levels, centered on the session Open (111425), show the 1σ range from 110075 to 112775, with upper tail extensions beyond 115190 (PT3).
HVOL levels, centered on the Close (112245), place the 1σ band between 110895 and 113595, reinforcing upward drift.
JATS Volatility Compression Index (VCI) stands at 1.42, indicating that realized volatility is outpacing historical norms.
JATS Volatility Dispersion Index (VDI) prints at 0.50, suggesting moderate clustering around current levels, typical of a pre-breakout state.
Volatility term structure also confirms this dynamic, with near-dated RVOL readings exceeding both Weekly and Monthly HVOL, projecting potential directional movement.
Options Market Dynamics
Dealer hedging dynamics remain neutral:
Net Gamma Exposure (GEX) at 112500 is effectively 0, signaling no meaningful dealer lean.
Gamma Flip Strike is pinned at 112500, denoting the level at which dealer hedging behavior could reverse direction.
Volume-Weighted Open Interest Change (VWOC) is neutral, with very low churn and minimal call/put buildup.
The Skew Slope Ratio (SSR), calculated from directional skew between call and put IV slopes, is 0.00 at ATM (112500), indicating no dominant directional bias.
Smile Skew Momentum, a measure of slope acceleration, is flat. This indicates that there is no emerging pressure to force skew reversion, and the term structure is stabilizing.
ΔGEX, the percentage change in gamma exposure across strikes, prints at +18%, reflecting rising hedging sensitivity and expanding dealer participation if range breaks occur.
Price Action Analysis
BTC is holding near the Weekly RVOL 1Aσ OPEN level (111605), with short-term price magnetism observed toward this zone. Key observations:
Price remains below the HVOL PT1 (113595) but above the Max Pain anchor (109500)
A move above 114680 (90-Day HVOL 1Aσ OPEN) will likely trigger gamma destabilization, unlocking expansion toward 115085 (30-Day HVOL 1Aσ OPEN)
A breakdown through 107675 (Weekly RVOL 1Bσ OPEN) risks a reflex move toward 105870, coinciding with deeper volatility pivots
JATS PT Levels (OPEN-based and CLOSE-based)
OPEN-based RVOL PT Levels (FOpen: 111425)
PT3B: 107660
PT2B: 108890
PT1B: 110075
OPEN: 111425
PT1A: 112775
PT2A: 113960
PT3A: 115190
CLOSE-based HVOL PT Levels (FStl: 112245)
PT3B: 109295
PT2B: 109705
PT1B: 110895
CLOSE: 112245
PT1A: 113595
PT2A: 114785
PT3A: 115195
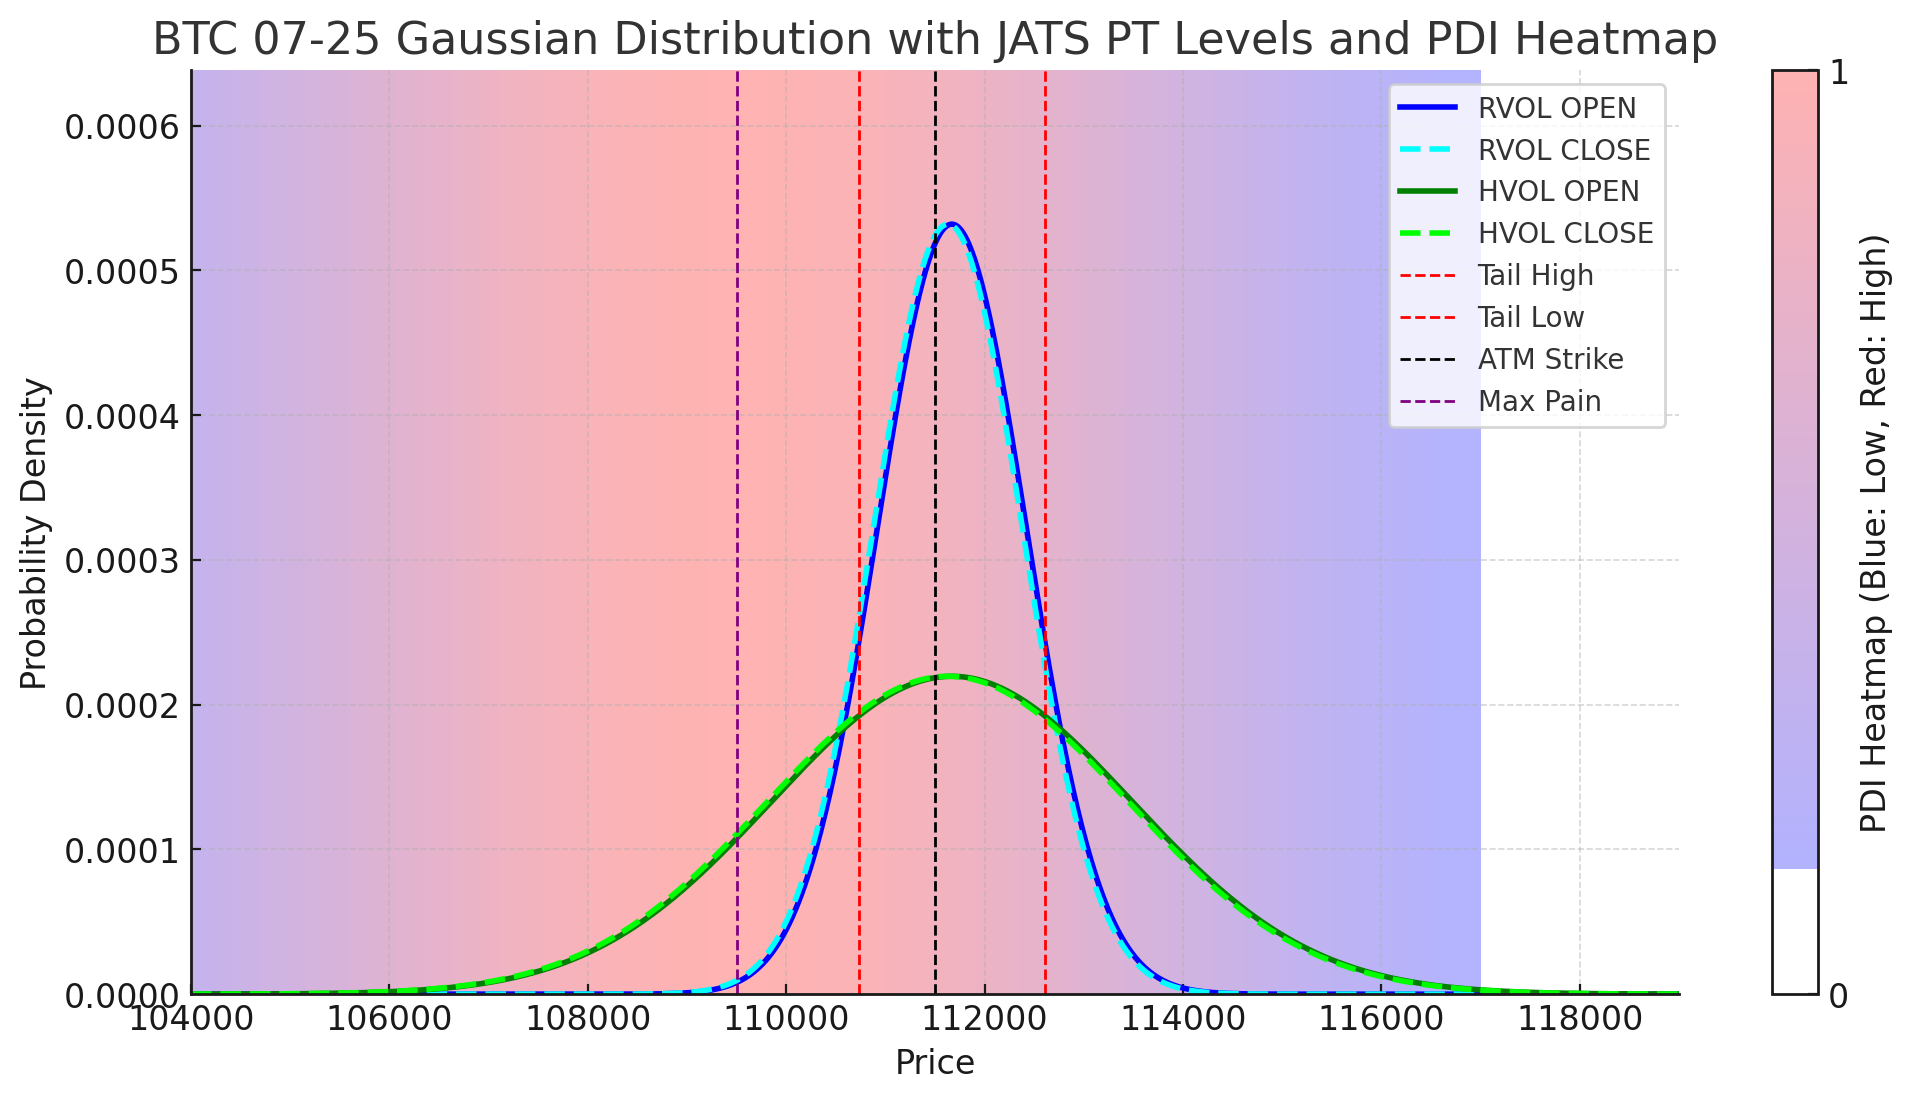
Probability Distribution Chart
A Gaussian overlay confirms BTC is drifting toward upper 1σ zones, but with limited tail risk extension.
Tail Alert Zones are flagged at 116166.5 (Upper) and 106683.5 (Lower), calculated as ±0.75σ extensions from RVOL PT3.
Pin Density Index (PDI) = 0.30, highlighting weak pinning forces and increasing potential for directional escape.
Probability density is concentrated between 110000–113500, with limited outlier pull until skew or volume re-engages.
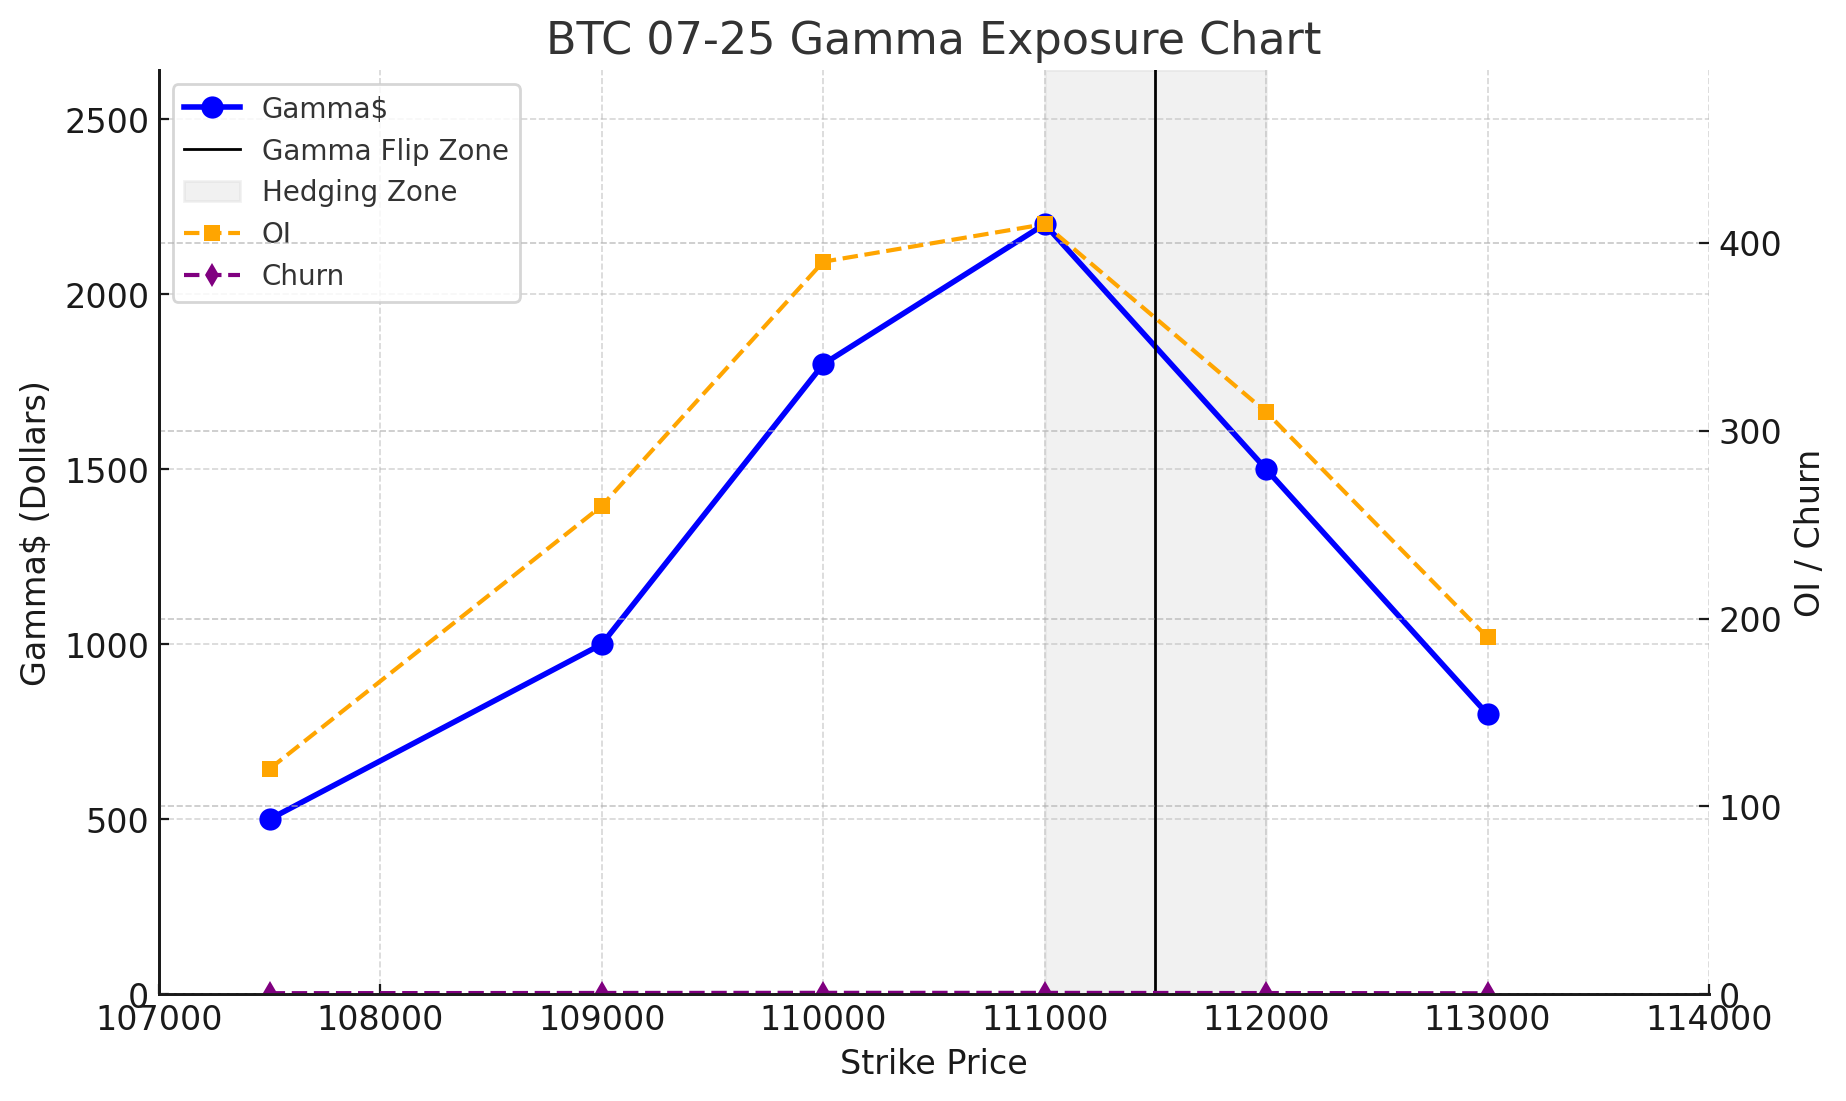
Gamma Exposure Chart
The gamma structure reveals a peak at 111000–111500 with sharp drop-off above 112000. The gamma flip aligns perfectly with the ATM strike, signaling dealer neutrality. Hedging activity is heaviest in the 111000–112000 band. This reinforces a strong containment narrative, with limited impulse to chase volatility unless price breaks sharply above 112000 or falls below 110000.
Interpretation:
Peak Gamma sits near 111000–111500, with highest exposure at 2200.
Gamma Flip Zone aligns closely with ATM strike (111500), confirming neutral dealer positioning.
Hedging Zone spans 111000–112000, implying heightened delta hedging risk in that corridor.
OI and Churn cluster just beneath Max Pain (109500) and peak around 110000–111000, indicating active dealer flow near pin zones.
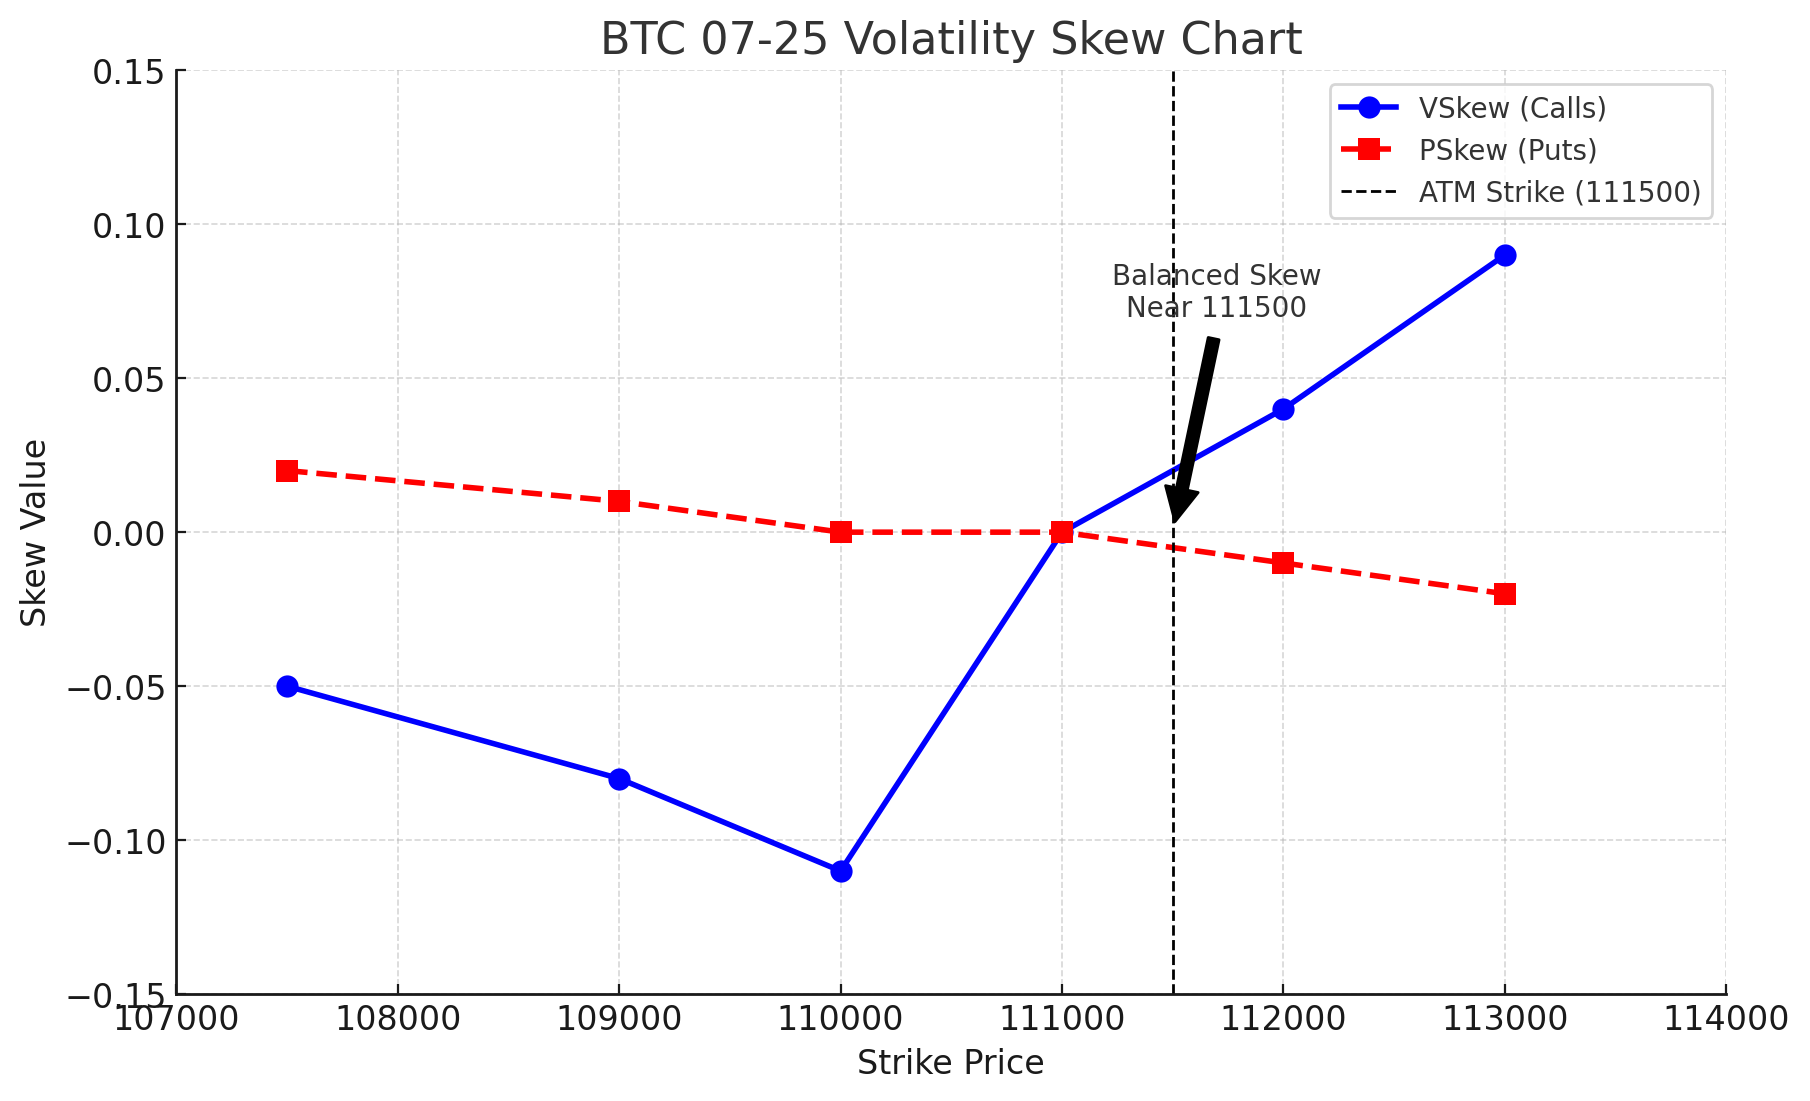
Volatility Skew Chart
Call skew accelerates above 112000, reflecting bullish speculative hedging. Put skew remains flat, reflecting complacency or absence of panic hedging. Skew momentum favors mild bullish bias but is not extreme. The symmetrical smile shape flattens near ATM, indicating a balanced risk distribution with a slight right-tail lean.
HALO Metrics Panel
• VCI = 1.42 → Realized volatility expanding faster than historical average
• VDI = 0.50 → Volatility density shows pre-breakout compression
• Net Dealer Delta Exposure = -7.41 (from P2EN5 SHT 50) → Slight net short positioning from dealers
• ΔGEX = +18% → Dealer gamma exposure rising; watch for volatility trigger points
• VWOC = Neutral → No significant accumulation of calls or puts
• Smile Momentum = Flat → No strong pressure from skew structure
Strategy Implications
Bias: Neutral-to-mildly bullish
Short Gamma Window: 111605–114680
Theta Play: Favor selling short-dated ATM straddles (churn: 0.30)
Directional Play: Long 1:2 call spreads below 112500, or breakout positioning if >114680
Risk: Gamma flip triggers may cause dealer unwind effects on breaches
Macro Overlay
There are no imminent regulatory headlines or crypto-specific events expected, though weekend positioning and macro liquidity changes (e.g., CPI/tech sector rebalancing) may introduce unforecasted volatility.
Key Takeaways
• BTC remains pinned between soft resistance at HVOL PT1 and soft support near RVOL PT1B
• GEX and Delta Exposure remain light but rising – expansion risk is building
• A breakout above 114680 would unlock dealer repositioning toward 115085
• Downside remains contained unless sub-107675, with Max Pain reversion pull
• Tier 1A signal active → Expansion risk favored
Alternate Scenarios Tracker
🟢 Bullish Breakout → Trigger: 114680+ → Outcome: Push to 115085+
🟡 Compression/Neutral → Trigger: 111000–114680 → Outcome: Low-volatility grind
🔴 Bearish Pullback → Trigger: <107675 → Outcome: Fast move to Max Pain or 105870
Summary Snapshot
Bias → Neutral to Mildly Bullish
Max Pain → 109500
ATM Strike → 112500
Dealer 1σ Range → 110075–112775
JATS Bias → Expansion Drift
Strategy → Short straddle or bullish call spreads
HALO Tier 1A → ✅ Active (ΔGEX > 5%)
Tail Extension Protocol
RVOL PT3 (115190) > HVOL PT3 (115195) → Expansion Valid
1.25x PT3: 116166.5
1.50x PT3: 116655.0
1.75x PT3: 117143.5
2.00x PT3: 117632.0
Tail Risk Score: 0.3 (Moderate)
Volatility Phase Classification (VPC)
Daily: Expansion
Weekly: Expansion
Monthly: Neutral
Quarterly: Neutral
VCI/VDI: 1.42 / 0.50
Timeframe Concordance Score
→ Moderate Alignment (short-term expansion consistent)
Phase Change Alert (PCA)
→ Expansion Shift Confirmed (RVOL > HVOL)
Pin Density Index (PDI)
PDI = 0.30 (Weak pinning, price can drift)
Tier 1 Signal Summary
• Tier 1A: ✅ Yes → ΔGEX > 5%
• Tier 1B: ❌ No → SSR = 0.00 (not > 1.1)
• Tier 1C: ❌ No → VDI < 0.6
→ Signal Basis: Active GEX build-up without strong skew or clustering
Acronym Legend
• PT1/PT2/PT3: Probability-based price targets
• RVOL/HVOL: Realized vs Historical Volatility
• VCI/VDI: Volatility Compression/Dispersion Index
• SSR: Skew Slope Ratio
• VWOC: Volume-Weighted Open Interest Change
• GEX: Gamma Exposure
• ΔGEX: Change in Gamma Exposure
• ATM: At-The-Money Strike
• GTI/DPM/SSR: Dealer Positioning Metrics
• PDI: Pin Density Index
• VPSO: Volatility Phase Signal Overlay
• HALO: Hierarchical Analytics for Liquidity and Orderflow
Acronym Legend
RVOL/HVOL: Realized vs Historical Volatility
GEX: Gamma Exposure
PDI: Pin Density Index
VCI: Volatility Compression Index
VDI: Volatility Density Index
ΔGEX: Gamma Acceleration
VWOC: Volume-Weighted Open Interest Change
GTI: Gamma Tilt Index
SSR: Sentiment Skew Ratio
PCA: Phase Change Alert
VPC: Volatility Phase Classification
DPM: Dealer Positioning Momentum
JATS LEVELS


DAILY

WEEKLY

MONTHLY

QUARTERLY


Disclaimer:
J Auto Trading Strategies, LLC ("JATS") is not a registered broker-dealer, investment advisor, or financial planner. The tools, indicators, strategies, and content provided—including but not limited to JATS PT™, V‑SNAV™, and HALO™—are for educational and informational purposes only. Nothing contained herein constitutes a solicitation or recommendation to buy or sell any securities or derivatives. Trading futures, cryptocurrencies, and options involves substantial risk and is not suitable for every investor. Always consult a licensed financial professional before making trading decisions. JATS retains all proprietary rights to its indicators and methodologies. Unauthorized distribution or replication is strictly prohibited.
Risk Disclosure:
Futures, options, and cryptocurrency trading involve substantial risk and are not suitable for every investor. An investor could potentially lose all or more than the initial investment. Only risk capital should be used for trading, and only those with sufficient risk capital should consider trading. Past performance is not necessarily indicative of future results.
Hypothetical Performance Disclosure:
Hypothetical performance results have inherent limitations. Unlike actual performance records, hypothetical results do not represent actual trading and may under- or over-compensate for the impact of certain market factors. No representation is being made that any account will or is likely to achieve profits or losses similar to those shown.
Platform Disclosure:
NinjaTrader® is a registered trademark of NinjaTrader Group, LLC. No NinjaTrader company has any affiliation with the owner, developer, or provider of the products or services described herein, or any interest, ownership, or endorsement in any such product or service.
© 2025 J Auto Trading Strategies, LLC. All Rights Reserved.
JATS PT™, V‑SNAV™, and HALO™ are trademarks of J Auto Trading Strategies, LLC. All content and proprietary methodologies are protected by copyright and may not be reproduced or distributed without express written permission.